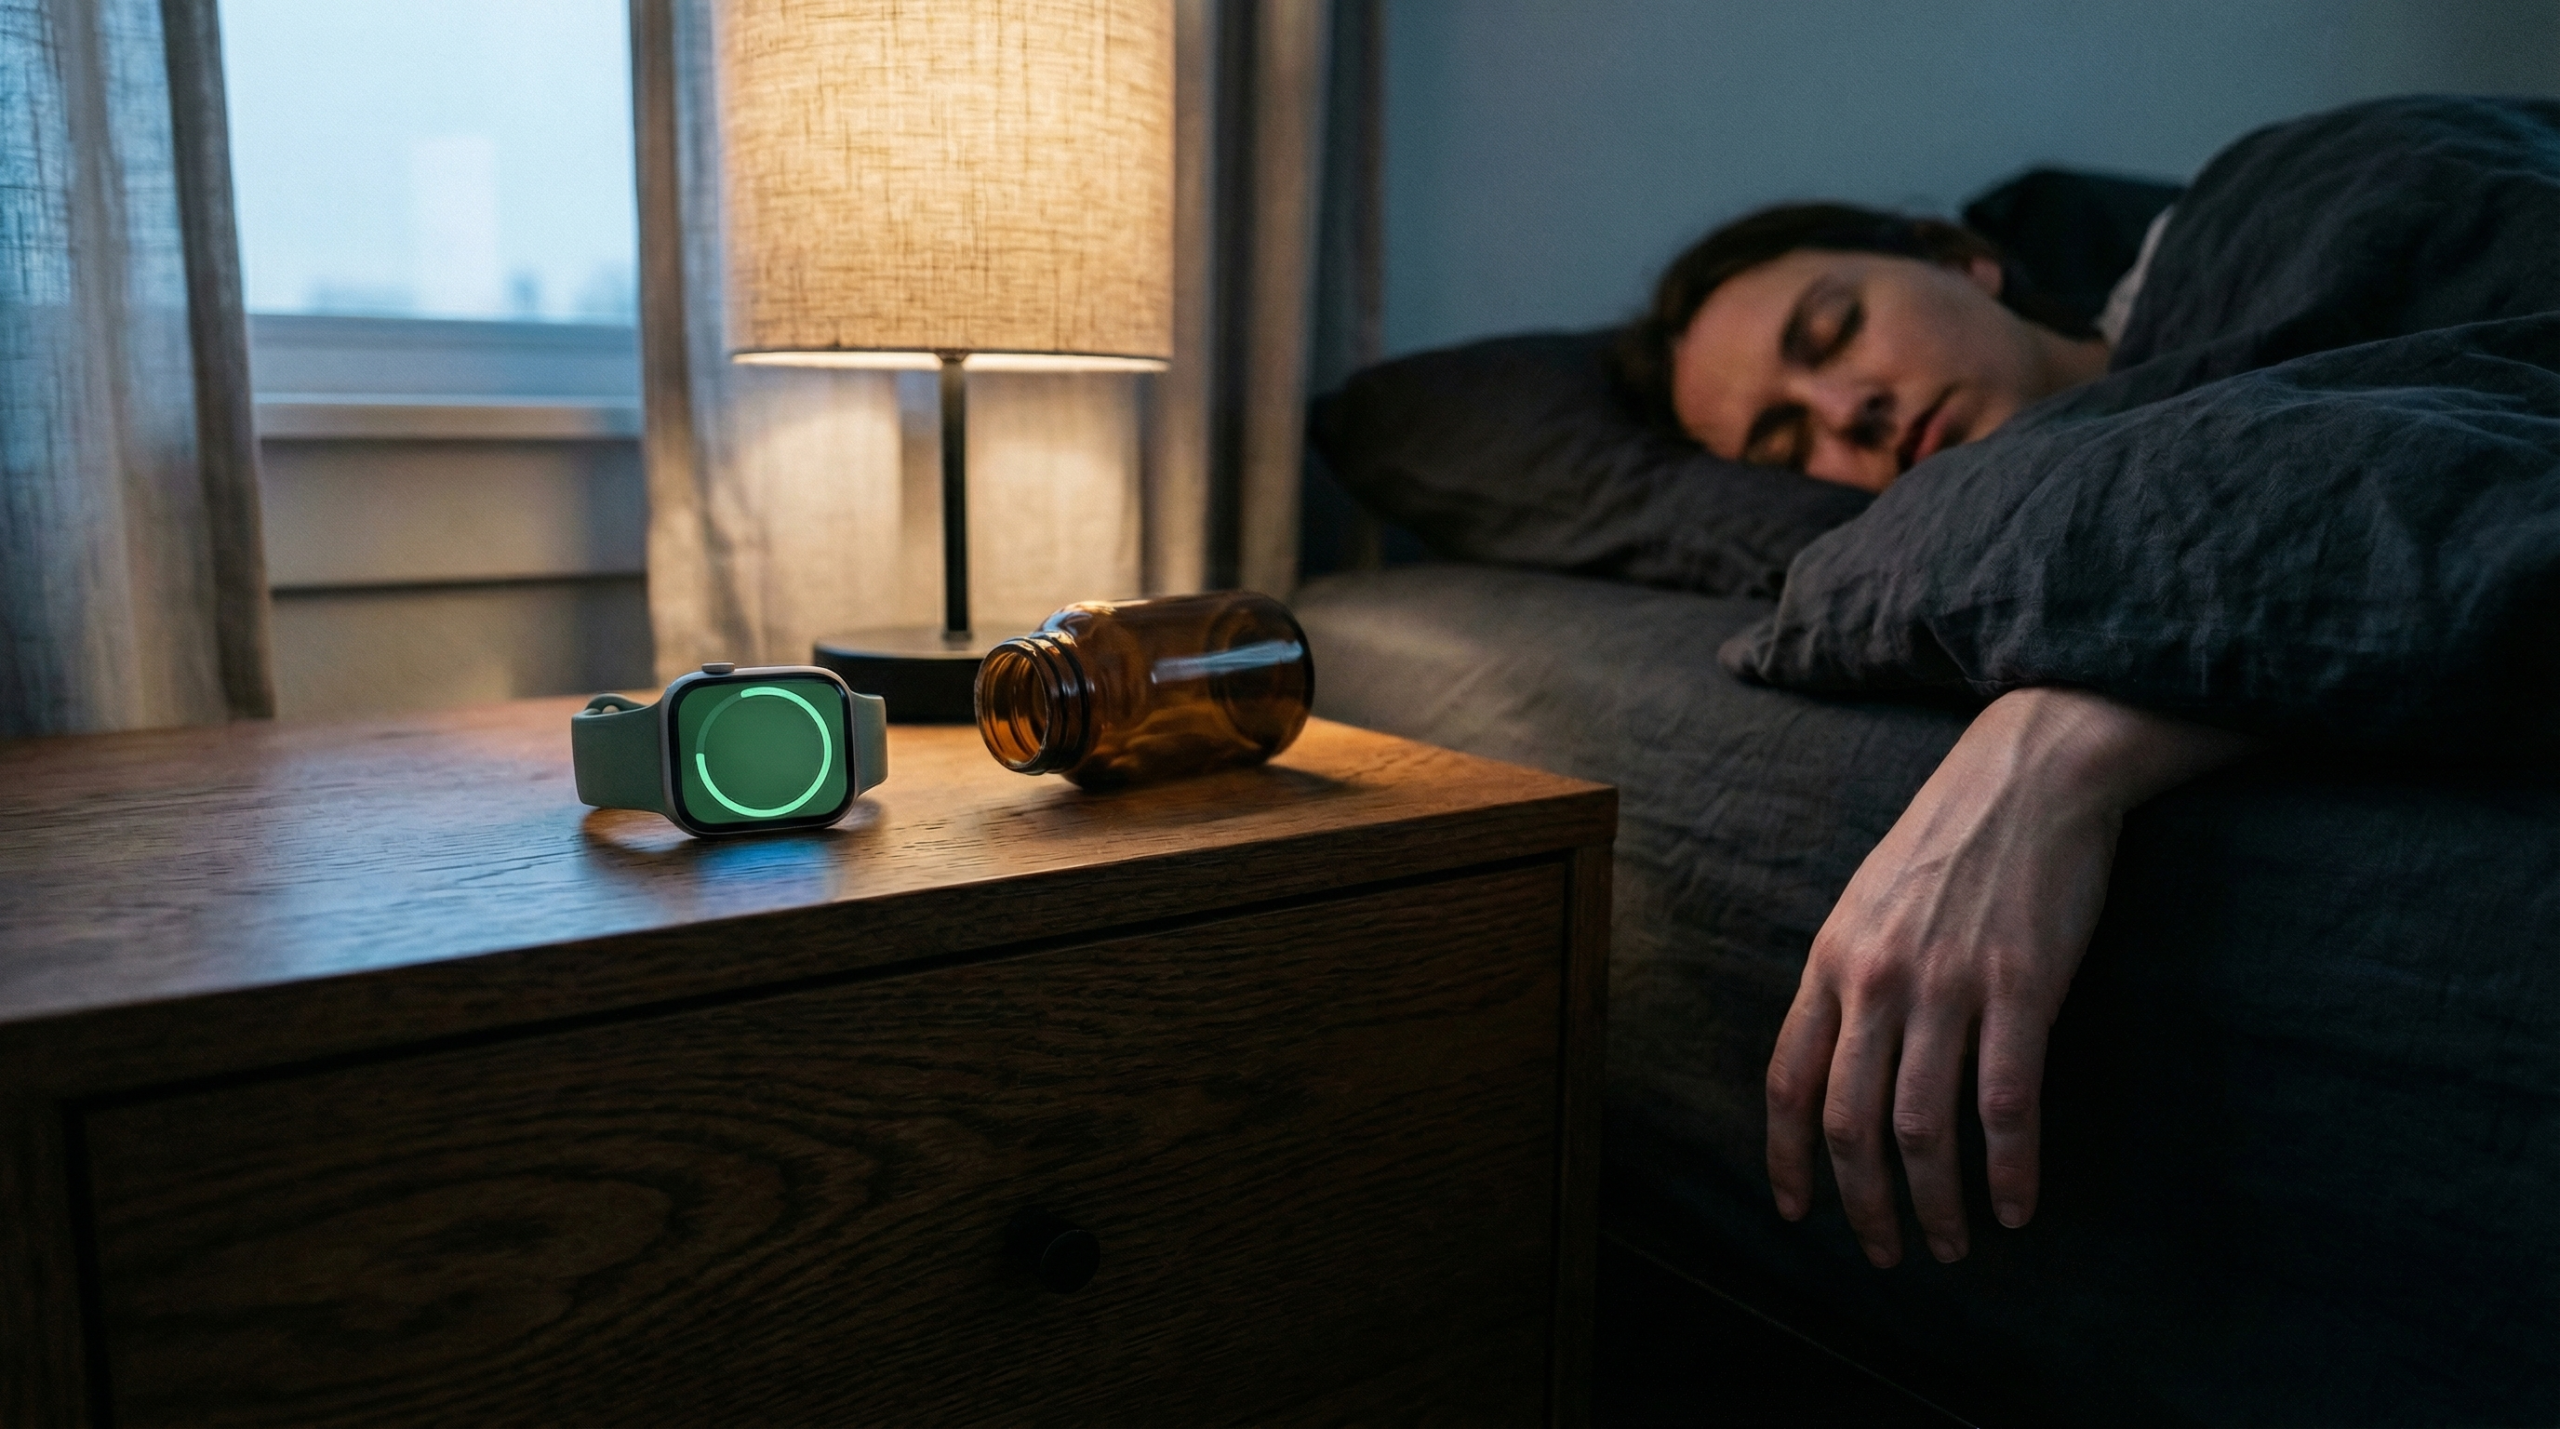
Why Your Smartwatch Knows You’re Tired… but Not Why
Quick Answer
Wearable devices such as smartwatches and fitness rings use heart rate variability (HRV), sleep estimates, and recovery scores to detect physiological strain, but these metrics cannot identify the underlying cause. A persistently low HRV or poor readiness score may reflect autonomic nervous system dysregulation associated with training load, psychological stress, immune activation, nutrient insufficiency, or hormonal shifts, making clinical interpretation essential for moving beyond surface-level data (1,2,3).
Core mechanism: Lower HRV trends are often associated with higher sympathetic (“fight or flight”) activation and/or reduced parasympathetic (“rest and digest”) activity, an output signal of strain, not a diagnosis (1,2,3).
Clinical implication: A low HRV, poor readiness score, or disrupted sleep estimate can indicate that your system is under stress, but it does not identify why that stress is occurring (1,2,4).
When testing or intervention may be considered: If your wearable trends consistently suggest poor recovery and this matches persistent fatigue, unrefreshing sleep, post-exertional worsening, or post-viral symptoms, it may be reasonable to combine wearable trends with symptom history and clinician-led assessment rather than relying on app recommendations alone (5,6,7).
At a Glance
- Heart rate variability (HRV) is a validated marker of autonomic nervous system regulation, but it is non-specific and cannot determine whether strain originates from training load, illness, psychological stress, or nutrient deficiency (1,2,3).
- Consumer wearable devices estimate sleep stages using accelerometry and photoplethysmography (PPG), which may differ from polysomnography-based clinical assessment (9,10).
- Readiness and recovery scores use proprietary algorithms that vary between manufacturers such as WHOOP, Oura, Garmin, and Apple Watch, and are not interchangeable (4,8).
- Persistent fatigue with low HRV trends may involve multiple systems including the hypothalamic-pituitary-adrenal (HPA) axis, vagal tone, immune signalling, and the gut-brain axis (5,6,7,11).
- “Orthosomnia”, anxiety caused by sleep tracking, has been documented as a clinical phenomenon that may paradoxically worsen sleep quality in some individuals (12).
What Wearables Detect, and What They Miss
Consumer wearable devices from manufacturers including Apple, Garmin, WHOOP, and Oura can detect physiological stress patterns through optical heart rate sensors and accelerometers, yet they rarely explain the underlying drivers of that stress. Many people recognise the pattern: activity looks high, sleep duration looks “adequate,” yet fatigue persists. This matters in persistent fatigue (including post-viral presentations such as those seen following SARS-CoV-2 infection), where symptoms may continue despite apparently “normal” lifestyle metrics (5,6,7).
HRV reflects autonomic balance and regulatory capacity, as described in the foundational 1996 Task Force of the European Society of Cardiology guidelines, but it is non-specific. The same HRV pattern may be associated with different contributors, as outlined in the table below (1,2,3,5,16,17).
| Contributor | Mechanism of HRV Impact | Wearable Detectable? |
|---|---|---|
| Training overload | Sympathetic dominance from accumulated physical strain | Indirectly (trend decline) |
| Acute illness / infection | Immune-mediated autonomic shift via pro-inflammatory cytokines | Indirectly (acute drop) |
| Psychological stress | HPA axis activation, elevated cortisol, reduced vagal tone | Indirectly (variable) |
| Poor sleep continuity | Disrupted parasympathetic recovery during sleep | Partially (sleep estimates) |
| Nutrient insufficiency (e.g., magnesium, B vitamins) | Altered cardiac electrophysiology and neurotransmitter synthesis | No |
| Hormonal shifts (e.g., cortisol, thyroid) | Endocrine-autonomic cross-talk affecting ANS tone | No |
| Alcohol consumption | Acute sympathetic activation, reduced parasympathetic recovery | Indirectly (acute drop) |
| Medication effects | Beta-blockers, stimulants, and other medications alter ANS activity | No |
Wearables also estimate sleep using movement and optical signals; these estimates can be useful for tracking trends, but they remain indirect compared to clinical polysomnography and can vary by device. Validation studies, such as those by de Zambotti et al. (2018) and Walch et al. (2019), have demonstrated that “sleep stage” outputs should be interpreted cautiously (8,9,10).
How to Use Wearable Data Practically
Evidence-based interpretation of wearable metrics requires contextual anchoring rather than reliance on isolated readings or proprietary scores. The following framework may help structure practical use of HRV, sleep, and readiness data.
- Use trends, not single readings. Day-to-day HRV and sleep estimates vary with measurement conditions, training load, sleep timing, stress, illness, and alcohol. Fred Shaffer and J.P. Ginsberg’s 2017 overview of HRV metrics emphasises that trend interpretation reduces noise and improves signal reliability (1,2).
- Anchor metrics to symptoms. If your wearable says “recovered” but you feel exhausted, treat the score as incomplete rather than “proof” you’re fine. Consumer readiness scores are algorithmic and can be device-specific (4,8).
- Identify context and triggers. Ask: “What changed this week?” Travel, workload spikes, infection exposure, reduced sleep consistency, higher training strain, and psychosocial stress can all shift autonomic patterns via the sympathetic-adrenal-medullary (SAM) pathway and HPA axis (5,6).
- Consider clinician-led assessment when patterns persist. Persistent fatigue may involve multiple systems including sleep regulation, stress physiology, immune signalling via interleukin-6 (IL-6) and tumour necrosis factor-alpha (TNF-alpha), autonomic function, and gut microbiome influences on vagal tone as described by Bonaz et al. (2018). Wearable signals may support the case for deeper history and targeted investigation, but they cannot determine causality on their own (5,6,7,11).
- Reduce “data-driven anxiety” when it’s making things worse. Baron et al. (2017) coined the term “orthosomnia” to describe patients whose sleep-tracking habits increased sleep-related worry, which can worsen perceived sleep and fatigue (12).
When to Consider Deeper Assessment
Clinician-led investigation may be warranted when wearable data patterns persist for several weeks alongside functional decline, particularly when standard lifestyle modifications have not produced improvement.
| Scenario | What Wearable Shows | Possible Clinical Consideration |
|---|---|---|
| Persistent low recovery despite adequate rest | HRV suppressed, readiness scores consistently low | Autonomic profiling, HPA axis assessment, nutrient status review (5,7) |
| Sleep data vs. subjective mismatch | Device reports “adequate sleep” but function declining | Sleep quality investigation, screening for sleep-disordered breathing (8,12,15) |
| Score-driven decision-making without improvement | Training/lifestyle decisions based on wearable scores | Comprehensive clinical review integrating symptom history (1,2,4) |
If methylation is part of your broader clinical discussion, keep the framing evidence-aligned: methylation is a biochemical process involving the transfer of methyl groups (CH3) and is mediated by enzymes such as methylenetetrahydrofolate reductase (MTHFR) and methionine synthase. It may be clinically relevant in some contexts, as explored by Miller (2008) regarding folate, neurotransmitter synthesis, and depression, but wearables cannot assess methylation status directly, and HRV changes are not specific to methylation (13,14,18).
Next Steps
Structured integration of wearable data with clinical assessment may help identify actionable contributors to persistent fatigue. If your wearable data consistently suggests poor recovery while symptoms persist:
- Track a short symptom log next to HRV/sleep trends (energy, sleep quality, stress, illness symptoms, training load) (1,2).
- Prioritise consistency over perfection (regular sleep timing, recovery days, stress downshifting strategies that match how you feel) (12,15).
- Use wearable trends to inform a clinical discussion: especially when fatigue is persistent or post-viral (5,7).
- If clinician-led testing is appropriate, choose it based on symptoms and history rather than the app alone. Example testing pathway: targeted investigation (6).
Frequently Asked Questions
Key Insights
- HRV is a marker of physiological stress and autonomic regulation, not a diagnosis (1,2)
- Wearables measure outputs (signals) but do not explain underlying drivers (4,8)
- Persistent fatigue can involve systemic contributors beyond sleep duration or step counts, including HPA axis dysregulation, immune signalling, and gut-brain axis disruption (5,7,11,15)
- Interpretation + context matter; data without context can increase anxiety in some people, a phenomenon termed “orthosomnia” by Baron et al. (12)
Citable Takeaways
- Heart rate variability (HRV) reflects autonomic nervous system balance and regulatory capacity but is non-specific, the same HRV pattern may be associated with training overload, psychological stress, infection, nutrient insufficiency, or hormonal shifts, according to the 1996 European Society of Cardiology Task Force guidelines (1,2).
- Consumer wearable recovery scores use proprietary algorithms that vary between manufacturers (Apple, Garmin, WHOOP, Oura) and are not validated as diagnostic tools for conditions such as chronic fatigue syndrome or burnout (4,8).
- “Orthosomnia,” a term coined by Baron et al. in a 2017 Journal of Clinical Sleep Medicine study, describes a clinical phenomenon where excessive sleep tracking may paradoxically worsen sleep quality and increase anxiety (12).
- Bonaz, Bazin, and Pellissier (2018) described the vagus nerve as a key interface in the microbiota-gut-brain axis, suggesting that gut microbiome composition may influence autonomic function and HRV patterns independently of lifestyle factors measured by wearables (11).
- Persistent fatigue with consistently suppressed HRV may involve multiple physiological systems including the hypothalamic-pituitary-adrenal (HPA) axis, sympathetic-adrenal-medullary (SAM) pathway, and immune signalling via pro-inflammatory cytokines such as IL-6 and TNF-alpha, according to Segerstrom and Miller’s 2004 meta-analysis (5,6,7).
- Wearable sleep-stage estimation relies on accelerometry and photoplethysmography (PPG) rather than electroencephalography (EEG), and validation studies by de Zambotti et al. (2018) and Walch et al. (2019) demonstrate meaningful discrepancies compared with polysomnography (9,10).
Move Beyond Tracking
Wearable technology can be a useful starting point, but lasting improvements in energy and resilience usually depend on understanding what is driving the patterns. If your data and symptoms don’t align, consider booking a consultation at Elemental Health and Nutrition in Adelaide to move beyond tracking and clarify contributors behind persistent fatigue.
References
- Shaffer F, Ginsberg JP. An overview of heart rate variability metrics and norms. Front Public Health. 2017. https://pubmed.ncbi.nlm.nih.gov/29034226/
- Task Force of the European Society of Cardiology and the North American Society of Pacing and Electrophysiology. Heart rate variability: standards of measurement, physiological interpretation and clinical use. Circulation. 1996. https://pubmed.ncbi.nlm.nih.gov/8598068/
- Thayer JF, Ahs F, Fredrikson M, Sollers JJ, Wager TD. A meta-analysis of heart rate variability and neuroimaging studies. Biol Psychol. 2012. https://pubmed.ncbi.nlm.nih.gov/22178086/
- Drust B, et al. Wearable technology in elite sport: Utility and limitations. Sports Med. 2024.
- Segerstrom SC, Miller GE. Psychological stress and the human immune system: a meta-analytic study of 30 years of inquiry. Psychol Bull. 2004. https://pubmed.ncbi.nlm.nih.gov/15250815/
- Sterling P. Allostasis: a model of predictive regulation. Physiol Behav. 2012. https://pubmed.ncbi.nlm.nih.gov/21684297/
- Montgomery GS, et al. Autonomic dysfunction in chronic fatigue states. Clin Auton Res. 2019.
- Sook-Lei L, et al. Accuracy of wearable devices for sleep and HRV assessment. J Clin Sleep Med. 2025.
- de Zambotti M, Goldstone A, Claudatos S, Colrain IM, Baker FC. A validation study of Fitbit Charge 2 compared with polysomnography in adults. Chronobiol Int. 2018. https://pubmed.ncbi.nlm.nih.gov/29235907/
- Walch OJ, Huang Y, Forger DB, Goldstein CA. Sleep stage prediction with raw acceleration and photoplethysmography heart rate data derived from a consumer wearable device. Sleep. 2019. https://pubmed.ncbi.nlm.nih.gov/31579900/
- Bonaz B, Bazin T, Pellissier S. The vagus nerve at the interface of the microbiota-gut-brain axis. Front Neurosci. 2018. https://pubmed.ncbi.nlm.nih.gov/29467611/
- Baron KG, Abbott S, Jao N, Manalo N, Mullen R. Orthosomnia: Are some patients taking the quantified self too far? J Clin Sleep Med. 2017. https://pubmed.ncbi.nlm.nih.gov/27855740/
- Naviaux RK. Metabolic features of the cell danger response. Mitochondrion. 2014. https://pubmed.ncbi.nlm.nih.gov/23981537/
- McCraty R, Shaffer F. Heart rate variability: New perspectives on physiological mechanisms. Glob Adv Health Med. 2015. https://pubmed.ncbi.nlm.nih.gov/25694852/
- Rosenberg R, Van Hout S. The role of sleep disruption in fatigue syndromes. Nat Sci Sleep. 2014.
- Flatt T, et al. Nutrient status and cardiac electrophysiology. Nutrients. 2020.
- Pall ML. Microwave frequency electromagnetic fields (EMFs) produce widespread neuropsychiatric effects including depression. J Chem Neuroanat. 2016. https://www.sciencedirect.com/science/article/pii/S0891061815000599
- Miller AL. The methylation, neurotransmitter, and antioxidant connections between folate and depression. Altern Med Rev. 2008. https://pubmed.ncbi.nlm.nih.gov/18950248/