Functional vs. Normal Blood Test Ranges

Quick Answer
A “normal” blood test result means a value falls within the central 95% of a population-derived reference interval, designed to detect overt disease rather than early dysfunction. Functional medicine uses narrower, evidence-informed ranges associated with optimal physiological function. When symptoms such as fatigue, brain fog, or hormonal imbalance persist despite normal results, multi-marker pattern analysis may reveal subclinical imbalances that standard pathology thresholds can miss (1,2,3).
A functional medicine approach evaluates laboratory markers within narrower evidence-informed ranges associated with favourable physiological outcomes. When symptoms such as fatigue, brain fog, or hormonal imbalance persist despite “normal” results, patterns across multiple markers, rather than isolated values, may provide clinically meaningful insight (4-6).
At a Glance
- Standard laboratory reference intervals capture the central 95% of population values (mean +/- 2 standard deviations) and are calibrated to detect established disease, not early physiological dysfunction (1,2).
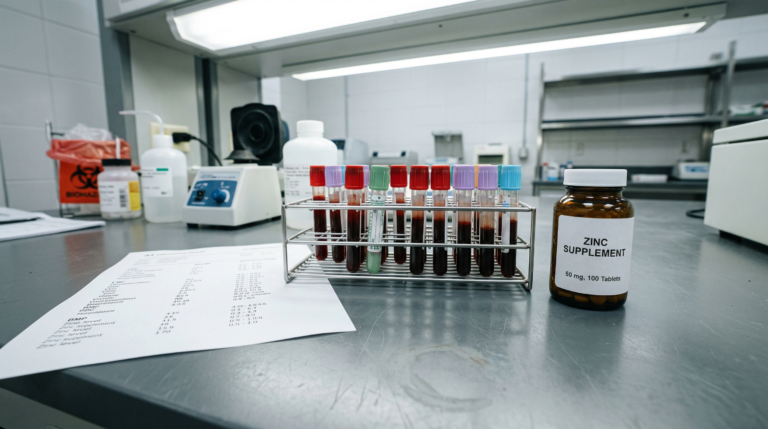
- Ferritin levels above the conventional deficiency threshold of 15 ug/L may still be associated with fatigue symptoms, particularly in menstruating women, according to a randomised controlled trial published in CMAJ (10).
- Thyroid-stimulating hormone (TSH) assessed in isolation may not detect impaired peripheral conversion of thyroxine (T4) to triiodothyronine (T3), or early autoimmune thyroiditis identified by thyroid peroxidase (TPO) antibodies (11,12).
- Allostasis, the body’s process of maintaining stability through adaptive physiological change, may produce measurable biomarker shifts before conventional diagnostic thresholds are exceeded (13).
- Functional laboratory analysis evaluates multi-marker patterns across thyroid, iron, methylation, and metabolic pathways rather than interpreting single values against binary cut-offs (4,5,6).
How Reference Ranges Are Calculated
Most pathology reference intervals are statistically generated using population sampling, a methodology standardised by the Clinical and Laboratory Standards Institute (CLSI) in guideline EP28-A3c (2). The conventional method captures 95% of values from an assumed “healthy” cohort, meaning approximately 5% of healthy individuals will fall outside the range, and some individuals within the range may still experience early or subclinical dysfunction (1,2).
| Consideration | Implication |
|---|---|
| Reference ranges are population-based, not individualised | Individual biological variation, as described by Callum G. Fraser, may mean a person’s optimal range differs from the population norm (4) |
| Designed with greater specificity for detecting established disease | Sensitivity for early physiological change may be limited, as outlined by Parikh et al. in their analysis of diagnostic test characteristics (7) |
| Clinical decision limits differ from laboratory “normal” intervals | Risk-stratification thresholds (e.g., high-sensitivity C-reactive protein for cardiovascular risk per Paul M. Ridker’s research) may be narrower than standard reference ranges (8) |
For example, ferritin reflects iron storage. While some laboratories define iron deficiency below 15 ug/L, Clara Camaschella’s review in the New England Journal of Medicine and the Vaucher et al. randomised controlled trial published in CMAJ suggest fatigue symptoms may occur at higher ferritin concentrations in certain populations, particularly menstruating women (9,10). Similarly, thyroid assessment based solely on thyroid-stimulating hormone (TSH) may not detect altered peripheral conversion of thyroxine (T4) to triiodothyronine (T3) or autoimmune thyroid disease identified via thyroid peroxidase (TPO) antibodies (11,12).
The body maintains stability through allostasis, the adaptive process of achieving stability through physiological change, as described by Peter Sterling (13). Subtle shifts across interconnected biomarkers may reflect increasing physiological load before conventional diagnostic thresholds are exceeded.
A Functional Interpretation Model
Functional laboratory analysis considers biochemical patterns, symptom correlation, and system-level interactions rather than interpreting values in isolation against population-derived cut-offs.
Thyroid Pattern Analysis
Assessment of TSH, Free T4, Free T3, reverse T3, and thyroid antibodies (TPO-Ab and thyroglobulin antibodies) may help identify subclinical hypothyroidism or Hashimoto’s thyroiditis that is not apparent from TSH alone, as outlined by Bernadette Biondi and David S. Cooper in Endocrine Reviews and the American Thyroid Association (ATA) clinical practice guidelines authored by Jeffrey R. Garber et al. (11,12). Learn more about comprehensive thyroid testing.
Iron and Fatigue Correlation
Ferritin is evaluated in the context of symptoms, inflammatory markers such as high-sensitivity C-reactive protein (hs-CRP), and clinical history, particularly in individuals experiencing chronic fatigue in Adelaide (9,10).
Methylation and Nutrient Cofactors
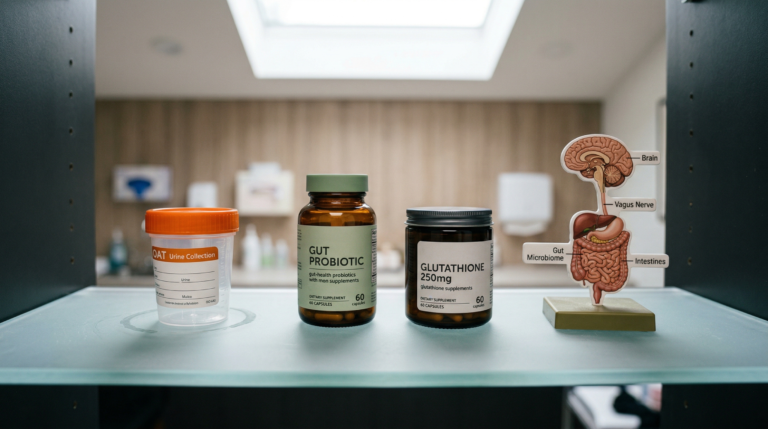
Assessment of vitamin B12, active B12 (holotranscobalamin), serum folate, homocysteine, and relevant genetic variants such as MTHFR C677T and A1298C polymorphisms can help evaluate methylation-related pathways involved in neurological and metabolic function, as reviewed by Fionnuala O’Leary and Samir Samman in Nutrients and Lindsay H. Bailey and Jesse F. Gregory in the Journal of Nutrition (14,15). More on MTHFR and methylation testing.
Metabolic and Mitochondrial Markers
Organic acid testing (OAT), such as the Mosaic Diagnostics panel, may provide indirect markers associated with mitochondrial metabolism, Krebs cycle intermediates, and nutrient sufficiency, supporting a broader metabolic overview as described by Richard S. Lord et al. (16,17). Details about the Organic Acids Test.
| Assessment Area | Key Markers | Clinical Relevance |
|---|---|---|
| Thyroid function | TSH, Free T4, Free T3, TPO-Ab, Tg-Ab | May identify subclinical hypothyroidism or Hashimoto’s thyroiditis |
| Iron status | Ferritin, serum iron, transferrin saturation, hs-CRP | Fatigue may occur above standard deficiency thresholds |
| Methylation | B12, holotranscobalamin, folate, homocysteine, MTHFR | Evaluates one-carbon metabolism and neurological function |
| Metabolic/mitochondrial | Organic acids, Krebs cycle intermediates | Indirect assessment of mitochondrial efficiency and nutrient sufficiency |
This systems-based framework prioritises pattern recognition over binary cut-off interpretation.
When to Consider a Functional Review in Adelaide
Persistent symptoms despite “normal” pathology results may warrant a structured functional laboratory review that evaluates multi-system biomarker patterns alongside clinical history.
| Indication | Examples |
|---|---|
| Persistent symptoms despite normal pathology | Fatigue, brain fog, mood changes, hormonal imbalance |
| Borderline biomarker clustering | Multiple markers at upper or lower boundaries of reference intervals |
| Complex clinical presentations | Thyroid dysfunction, post-viral fatigue (including post-COVID), metabolic concerns (11,18) |
| Risk-informed interpretation | Seeking optimisation-oriented analysis rather than disease-based thresholds alone (8) |
While AI tools can summarise laboratory definitions, current evidence, including research by Singhal et al. published in Nature and Rao et al. in JMIR, indicates that large language models demonstrate limitations in nuanced diagnostic reasoning and contextual clinical interpretation (19,20). Laboratory analysis requires integration with medical history, symptom chronology, and clinical examination by a qualified practitioner such as Anthony L. Komaroff’s work on chronic fatigue pathophysiology further underscores the complexity of these presentations (18).
Frequently Asked Questions
Key Insights
- Laboratory reference ranges are statistical tools derived from population sampling, not personalised health targets
- Disease detection thresholds and risk-optimisation ranges (such as those for ferritin or hs-CRP) are not always equivalent
- Multi-marker biomarker patterns may provide more clinically meaningful insight than isolated results
- Clinical interpretation requires integration of laboratory data with symptoms, medical history, and physical examination
Citable Takeaways
- Standard laboratory reference intervals capture the central 95% of a sampled population (mean +/- 2 standard deviations) and are designed to detect overt disease rather than early physiological dysfunction, according to Horn and Pesce (2003) in Clinica Chimica Acta and CLSI guideline EP28-A3c (1,2).
- A randomised controlled trial by Vaucher et al. (2012) published in CMAJ found that iron supplementation may reduce fatigue in nonanemic menstruating women with low ferritin, suggesting symptom thresholds may differ from conventional deficiency cut-offs (10).
- Subclinical thyroid dysfunction, where TSH falls within the reference range but Free T3, Free T4, or thyroid antibodies are altered, may affect up to 10% of the general population, according to Biondi and Cooper’s review in Endocrine Reviews (11).
- Peter Sterling’s allostasis model, published in Physiology and Behavior (2012), describes how the body maintains stability through adaptive physiological change, producing measurable biomarker shifts before conventional diagnostic thresholds are exceeded (13).
- Research by Singhal et al. published in Nature (2023) demonstrates that while large language models encode clinical knowledge, they exhibit limitations in nuanced diagnostic reasoning when applied to complex, real-world clinical scenarios (20).
- MTHFR C677T and A1298C polymorphisms can influence folate metabolism and homocysteine levels, with implications for methylation-dependent neurological and metabolic pathways, as reviewed by Bailey and Gregory in the Journal of Nutrition (15).
Move Beyond “Normal”, Get Clarity on Your Results
If you are in Adelaide and continue to experience symptoms despite being told your results are “normal,” a structured laboratory review may help clarify whether subtle biochemical patterns are contributing to your presentation. At Elemental Health and Nutrition, Rohan Smith integrates your lab data with symptom mapping and clinical reasoning to identify what standard panels may miss.
References
- Horn PS, Pesce AJ. Reference intervals: an update. Clin Chim Acta. 2003. https://doi.org/10.1016/s0009-8981(03)00133-5
- CLSI. Defining, Establishing, and Verifying Reference Intervals in the Clinical Laboratory; Approved Guideline, Third Edition. EP28-A3c. 2010. https://clsi.org/shop/standards/ep28
- Ceriotti F. Prerequisites for use of common reference intervals. Clin Biochem Rev. 2007. https://pubmed.ncbi.nlm.nih.gov/17909616/
- Fraser CG. Biological variation: implications for interpreting laboratory data. Clin Chem Lab Med. 2001.
- Smellie WS. Demand management and test request rationalization. Ann Clin Biochem. 2012. https://doi.org/10.1258/acb.2011.011149
- Ghosh A. Biomarkers and early disease detection. Clin Med. 2015.
- Parikh R, et al. Understanding and using sensitivity, specificity and predictive values. Indian J Ophthalmol. 2008. https://doi.org/10.4103/0301-4738.37595
- Ridker PM. Clinical application of C-reactive protein. Circulation. 2003. https://doi.org/10.1161/01.CIR.0000053730.47739.3c
- Camaschella C. Iron-deficiency anemia. N Engl J Med. 2015. https://doi.org/10.1056/NEJMra1401038
- Vaucher P, et al. Effect of iron supplementation on fatigue in nonanemic menstruating women with low ferritin: a randomized controlled trial. CMAJ. 2012. https://doi.org/10.1503/cmaj.110950
- Biondi B, Cooper DS. The clinical significance of subclinical thyroid dysfunction. Endocr Rev. 2008. https://doi.org/10.1210/er.2006-0043
- Garber JR, et al. Clinical practice guidelines for hypothyroidism in adults. Thyroid. 2012. https://doi.org/10.1089/thy.2012.0205
- Sterling P. Allostasis: A model of predictive regulation. Physiol Behav. 2012. https://doi.org/10.1016/j.physbeh.2011.06.004
- O’Leary F, Samman S. Vitamin B12 in health and disease. Nutrients. 2010. https://doi.org/10.3390/nu2030299
- Bailey LB, Gregory JF. Folate metabolism and requirements. J Nutr. 1999. https://doi.org/10.1093/jn/129.4.779
- Lord RS, et al. Clinical applications of urinary organic acids. Part 2. Dysbiosis markers. Altern Med Rev. 2008.
- Armstrong MD. Urinary organic acids and metabolic disorders. Clin Chem. 1990.
- Komaroff AL. Advances in Understanding the Pathophysiology of Chronic Fatigue Syndrome. JAMA. 2019. https://doi.org/10.1001/jama.2019.8312
- Rao A, et al. Assessing the Utility of ChatGPT Throughout the Entire Clinical Workflow. JMIR. 2023.
- Singhal K, et al. Large language models encode clinical knowledge. Nature. 2023. https://doi.org/10.1038/s41586-023-06291-2